
The Office of Sustainability partners with the SustainableUMD network of students, staff and faculty to collect and visualize sustainability-related quantitative data. The data dashboards in "Measuring Progress" use Tableau, an interactive visualization tool to help tell UMD's story of sustainability-related progress.
The Tableau dashboards in "Measuring Progress" are organized into story panes. The first introduces UMD's overarching goals and targets, and all subsequent panes invite you to further explore the related data. Move through the story panes using the gray buttons at the top of the dashboard or by clicking the arrows on either side of the gray bar. If you are using a mobile device, select the "Mobile Device View" option on the first page of the dashboard.
Interact with the data displays by changing data filters -- including dropdown menus, sliders, and clicking on graphs and legends to highlight data -- or by hovering over the displays for additional information as tooltips. Use the toolbar at the bottom of the dashboard to reset to the original view, move between views, share the dashboard, or download the dashboard.
To learn more about Tableau functionality, click through the information below:
Story Panes: navigating dashboards
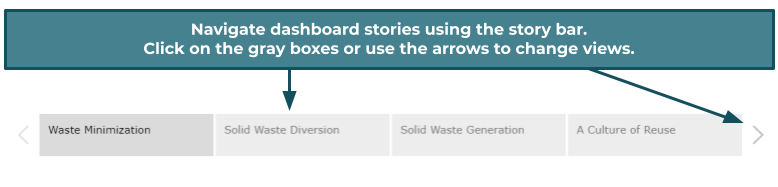
Each Tableau dashboard is viewable in a scrolling layout. Click the "Mobile Device View" on the first pane of the dashboard to view the alternate format.
Tooltips: hover over graphs for additional information
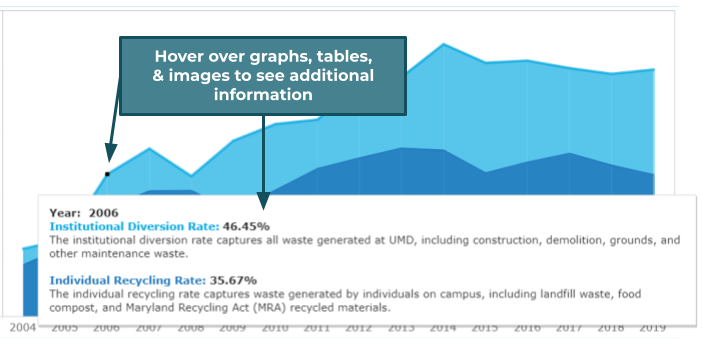
Tooltips will contain additional metrics, data values, or context that further explain the displayed content.
Data Filters: alter data and change graph views
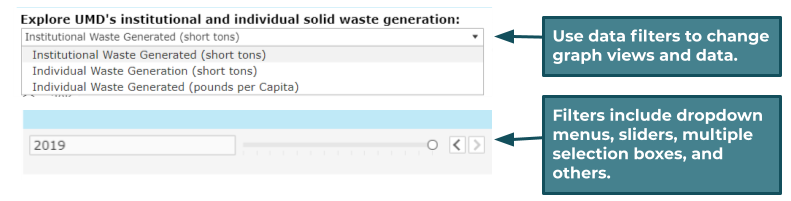
The most common data filter in the "Measuring Progress" dashboards allows you to filter visualized data by year. Other data filters will allow you to switch between graph types or displays.
Buttons and hyperlinked images
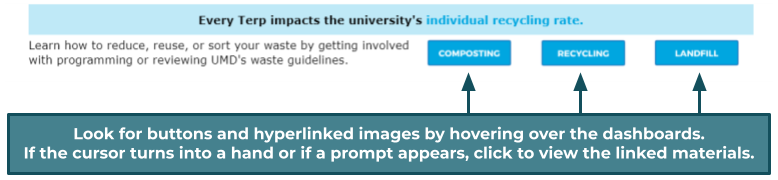
Buttons will link to other data displays, additional learning resources, or opportunities to get involved with sustainability-related efforts at UMD.
Highlighting: use legends and graphs to highlight data
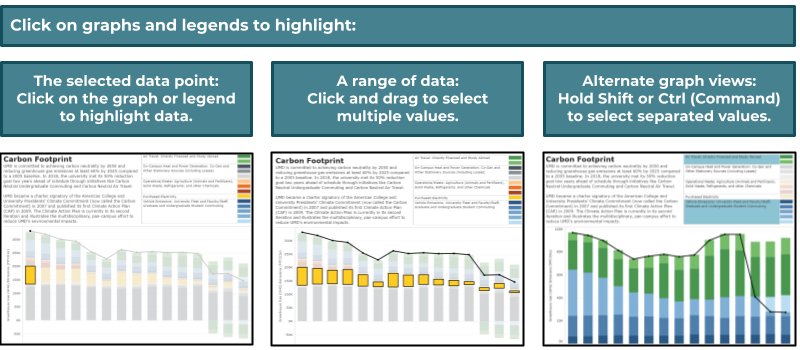
Tableau toolbar
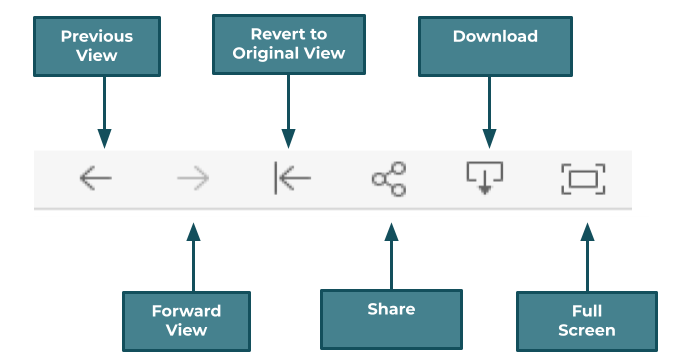 The Tableau toolbar is located on the bottom of the dashboard display. To the left, click "tableau" to visit the SustainableUMD Tableau Public profile. To the right, the various buttons allow you to:
- revert to the original dashboard view,
- move between views,
- share the dashboard,
- view in full-screen, or
- download the dashboard.